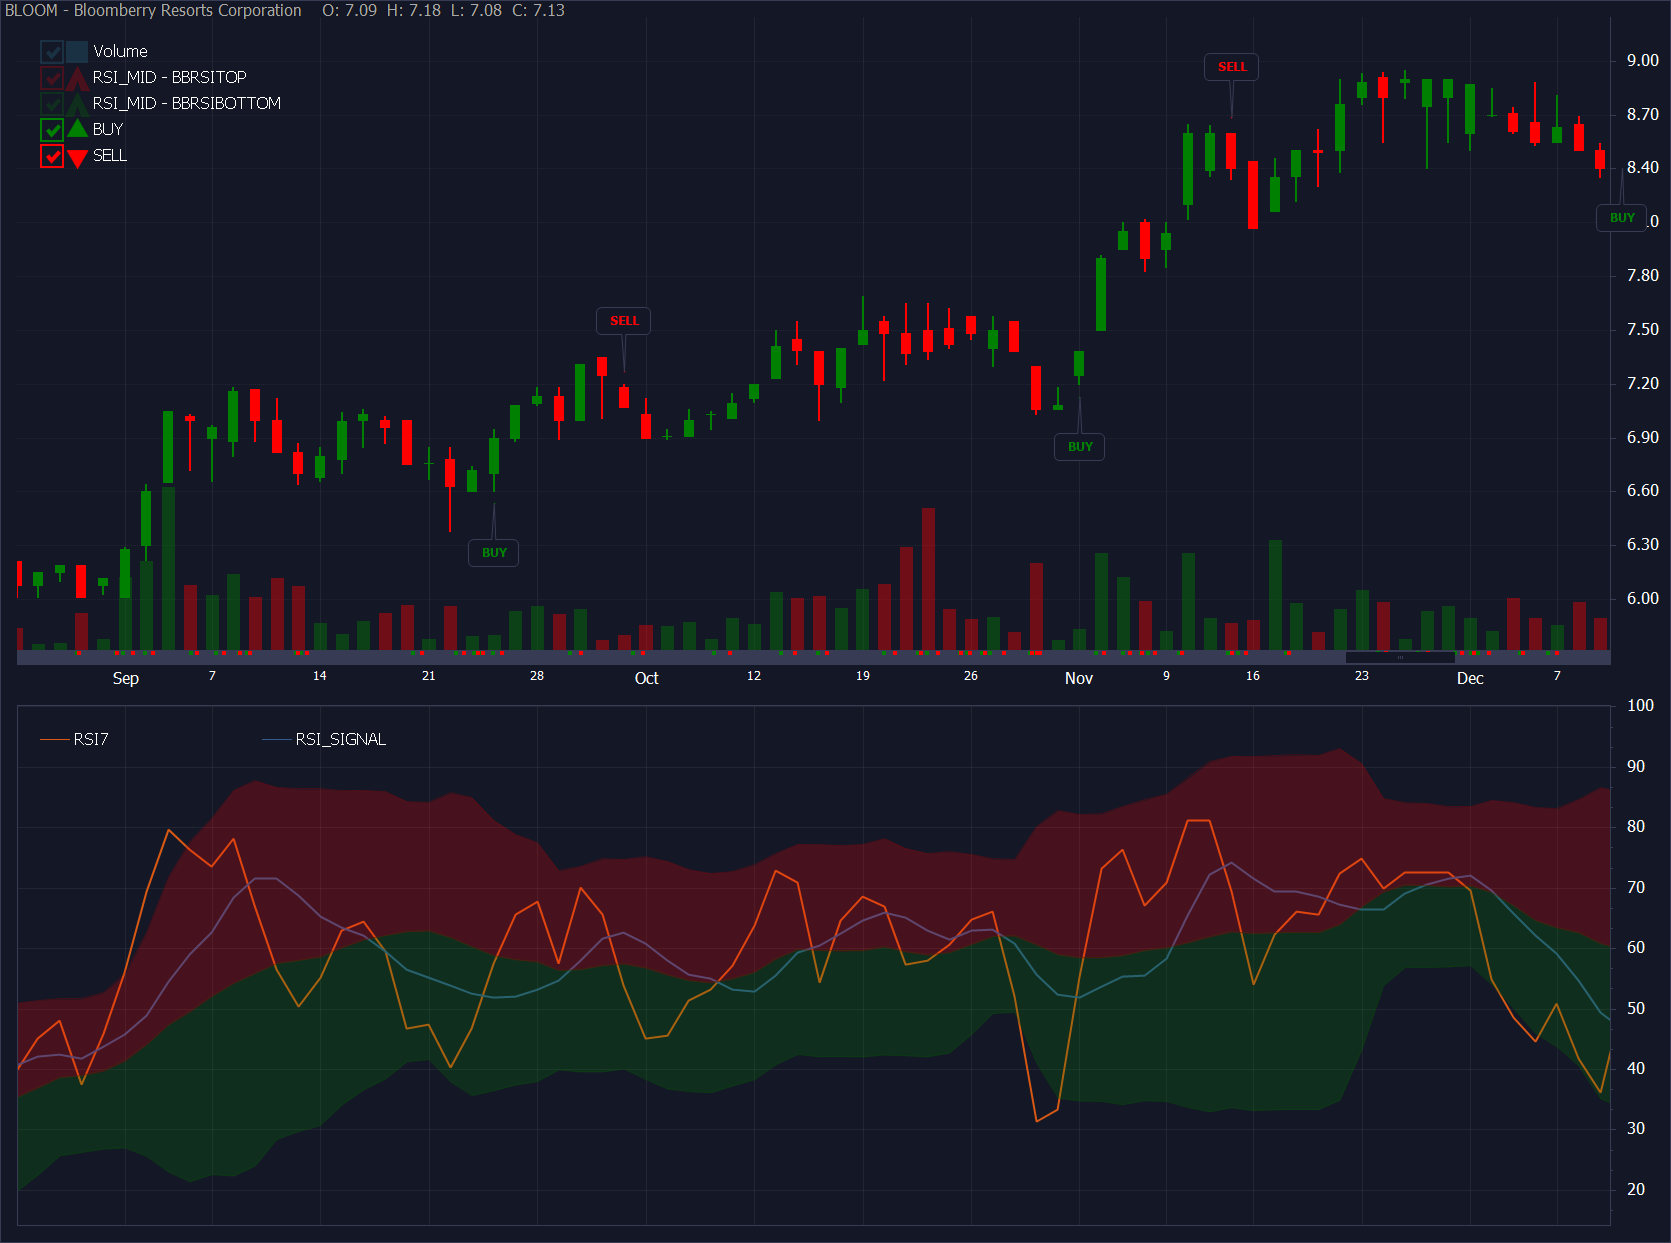
To use this screener, simply copy and paste the code below in your VAI Script Editor, save it and run! You can run it in the charts module to display the signals on the chart or run it in the screener module, which will show all the signals for that day.
You can find more tutorials here https://www.vaianalytics.com/knowledge-base/
Here is another example how you can use VAI to mix various indicators together to create unique systems. Here, we make of Bollinger bands (based on RSI instead of price), RSI 7 period and RSI Signal (which is basically the moving average of our RSI).
We create a buy signal whenever there is a RSI bullish crossover ONLY in the lower channel of the Bollinger Bands but create a sell signal on any RSI bearish crossover, regardless of position in the bands. This system is very situational and may lead to a lot of whipsaws, more optimization is required before I suggest using this in live trading.
#############################
// RSI - Bollinger Bands //
#############################
//Set Variables
Set Rsi7 = rsi(close,7)
//RSI Signal line
Set RSI_Signal= sma(Rsi7 ,7)
//Bollinger Bands using RSI(7)
Set BBRsiTop= BBT(Rsi7 , 15, 2, simple)
Set RSI_Mid= sma(Rsi7 ,15)
Set BBRsiBottom= BBB(Rsi7 , 15, 2, simple)
//Buy and Sell Signals
Set Buy = Crossover(Rsi7 ,RSI_Signal) and Rsi7 < RSI_Mid and RSI_Signal < RSI_Mid
Set Sell= Crossover( RSI_Signal,Rsi7 )
//Plot in Chart
Plot(Rsi7 ,Line,any,rsi_panel)
Plot(RSI_Signal,Line,any,rsi_panel)
PlotRange(RSI_Mid,BBRsiTop,red,rsi_panel)
PlotRange(RSI_Mid,BBRsiBottom,green,rsi_panel)
PlotBuySell(Buy ,Sell,green,red,main)
//Bactesting
signals(Buy,Sell)

