Notifications
Clear all
Topic starter
KEY TAKEAWAYS
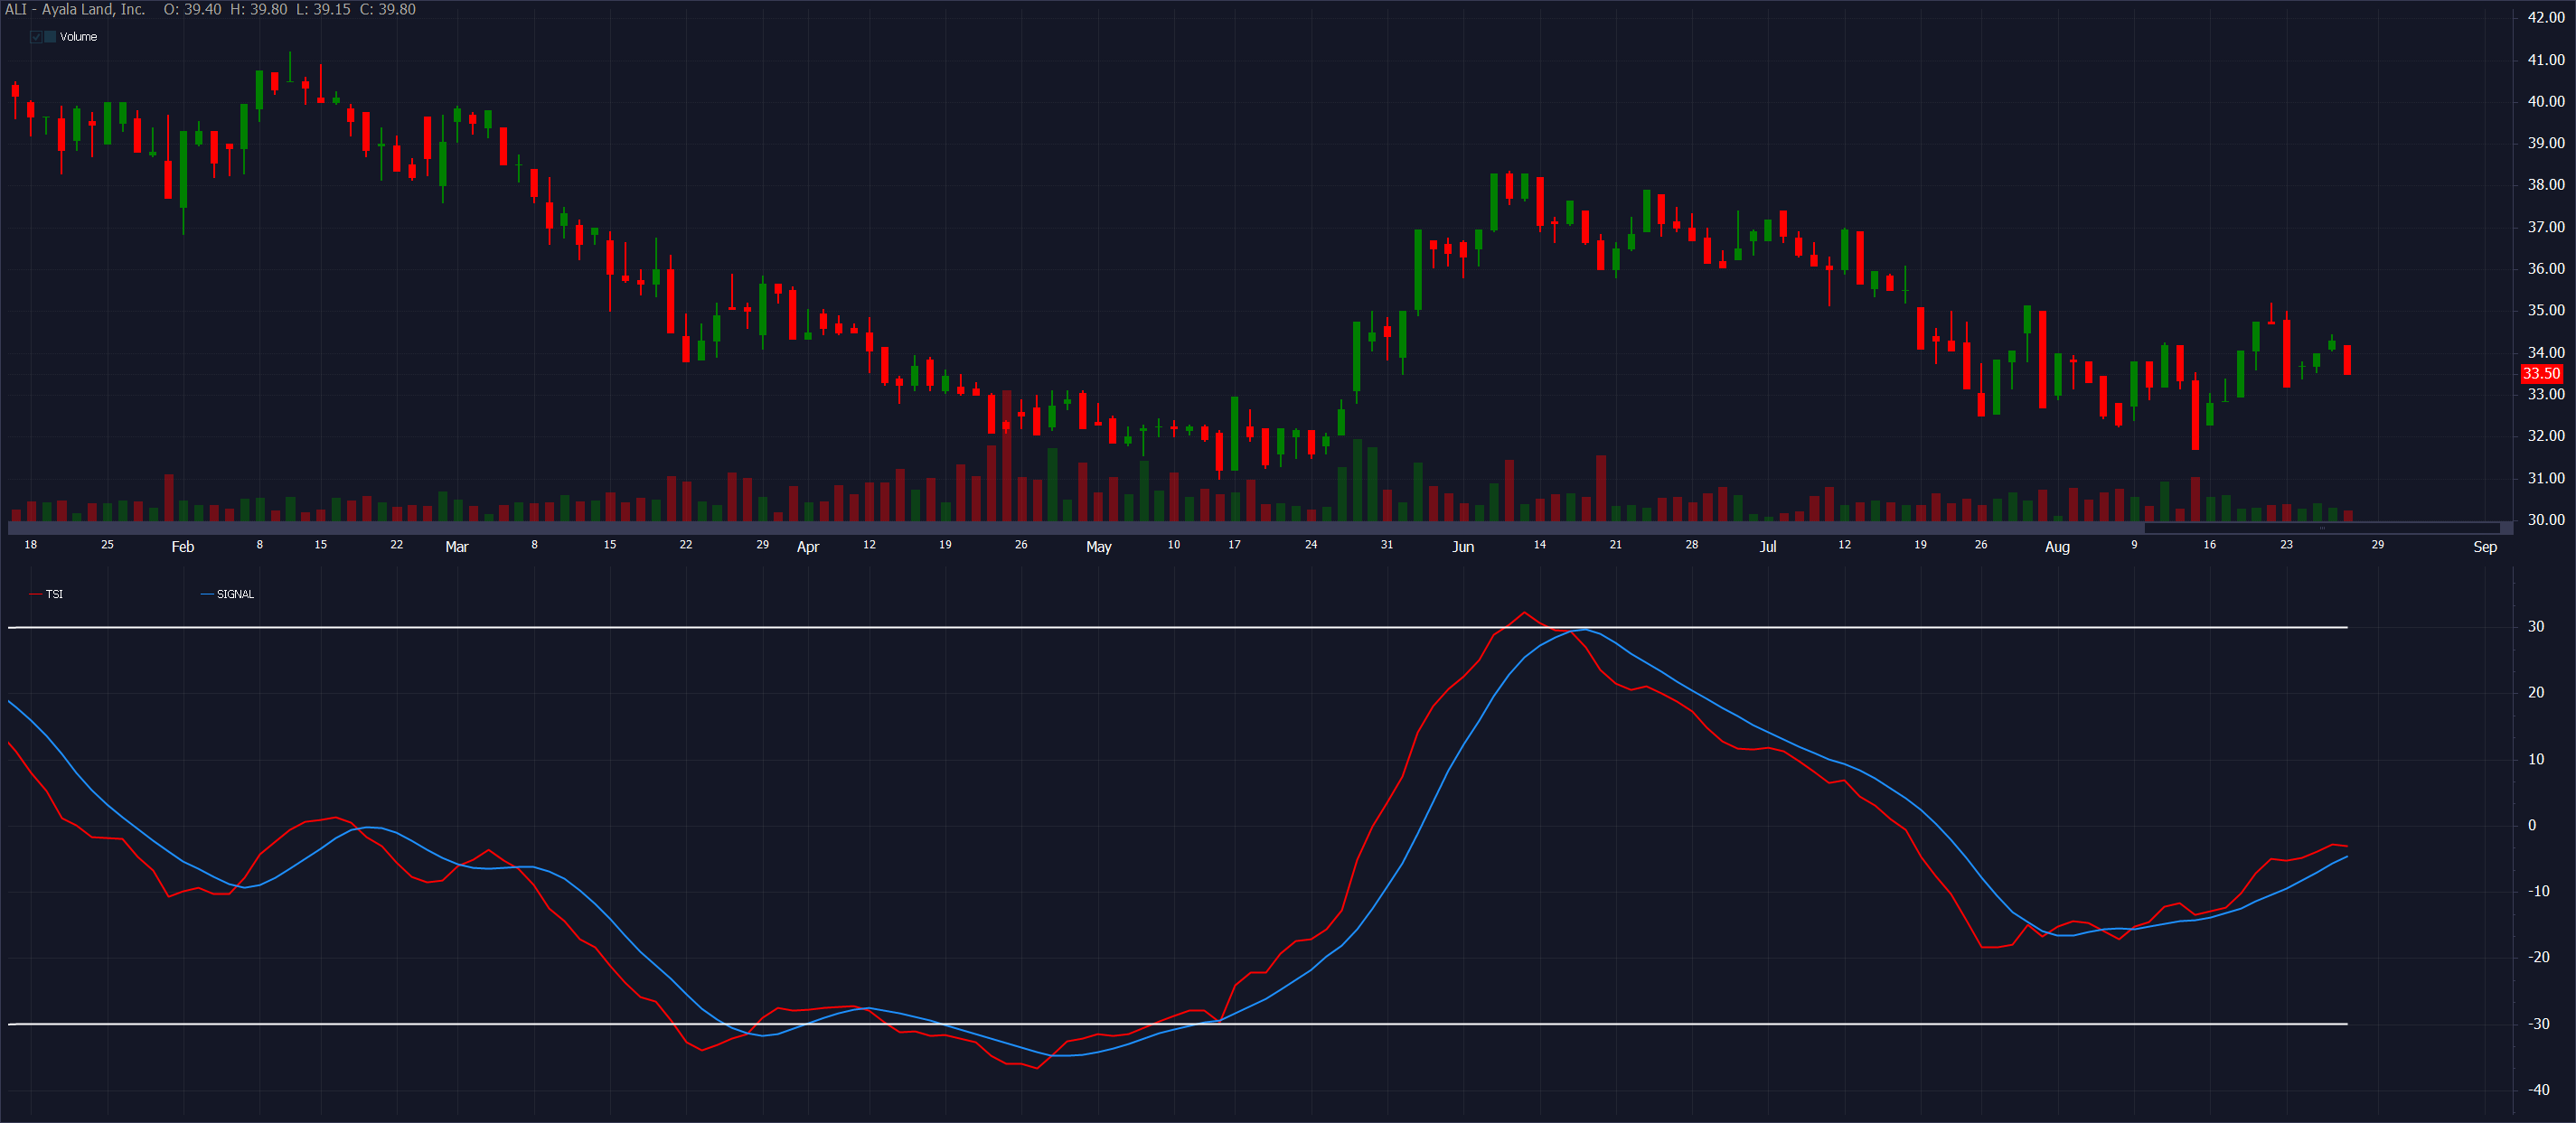
- The TSI fluctuates between positive and negative territory. Positive territory means the bulls are more in control of the asset. Negative territory means the bears are more in control.
- When the indicator divergences with price, the TSI may be signaling the price trend is weakening and may reverse.
- A signal line can be applied to the TSI indicator. When the TSI crosses above the signal line it can be used as a buy signal, and when it crosses below, a sell signal. Such crossovers occur frequently, so use with caution.
- Overbought and oversold levels will vary by the asset being traded.
Source: Investopedia
// True Strength Index
set pchange = close - ref(close,1)
set abschange = abs(pchange)
set emapchange1 = ema(pchange,25)
set emaabschange1 = ema(abschange,25)
set emapchange2 = ema(emapchange1,13)
set emaabschange2 = ema(emaabschange1,13)
set TSI = (emapchange2 / emaabschange2) * 100
set signal = sma(tsi,7)
plot(TSI,line,red,tsi)
plot(signal,line,dodgerblue,tsi)
plot(-30,line,white,tsi)
plot(30,line,white,tsi)
Posted : 27/08/2021 5:53 pm

